Exploratory Data Analysis of Los Angeles City Parcels#
Introduction and Problem Statement#
In recent years, there has been an upward trend in the real estate market in California, USA. According to a report by California Department of Finance, average price of single-family residential homes was 808K USD in September 2021, which indicates a 13.5% increase in the average price within a year. More specifically, the median sale price in Los Angeles (LA) County has risen by about 15% in the last year. Up until now, a 12% increase has been observed in the real estate market in LA County in 2022. Keeping the current inflation rate (8.5%) in mind, the questions to be answered are:
What could be the underlying reasons for the house prices to go up?
How were the trends in LA County in the previous years?
To find out the Assessor Parcels Data for LA County was selected to investigate total parcel values over the last 16 years. Consequently, a Machine Learning (ML) model has been developed to estimate the most recent parcel prices in LA City.
Exploratory Data Analysis#
As of April 2022, the Assessor Parcels Data — 2006 thru 2021 is comprised of 38,170,298 instances and 51 features for a total of 2,485,732 parcels located in LA County. In terms of general use type, more than 89% of the parcels are classified as Residential, and 4.2% are Commercial. The rest of the distribution of the column can be seen in Table 1. Property types of the parcels are classified into five categories: (i) SFR (Single Family Residence), (ii) CND (Condominium), (iii) R-I (Residential-Income), (iv) C/I (Commercial/Industrial), (v) Other. Another column in the dataset is the number of units located in each parcel. Parcels with a single unit account for 74% of the data, and the remaining ones are 12% for no unit, 5.4% for 2 units, 2.2% percent for 4 units, and 1.61% for 3 units.
General Use Type |
Ratio (%) |
Property Type |
Ratio (%) |
Unit |
Ratio (%) |
|---|---|---|---|---|---|
Residential |
89.3 |
SFR |
62.6 |
1 |
73.9 |
Commercial |
4.2 |
CND |
12.3 |
0 |
12.1 |
Industrial |
2.2 |
R-I |
10.3 |
2 |
5.4 |
Dry Farm |
2.1 |
C/I |
5.7 |
4 |
2.1 |
Other |
2.6 |
Other |
1.6 |
Other |
6.5 |
Feature Explorations#
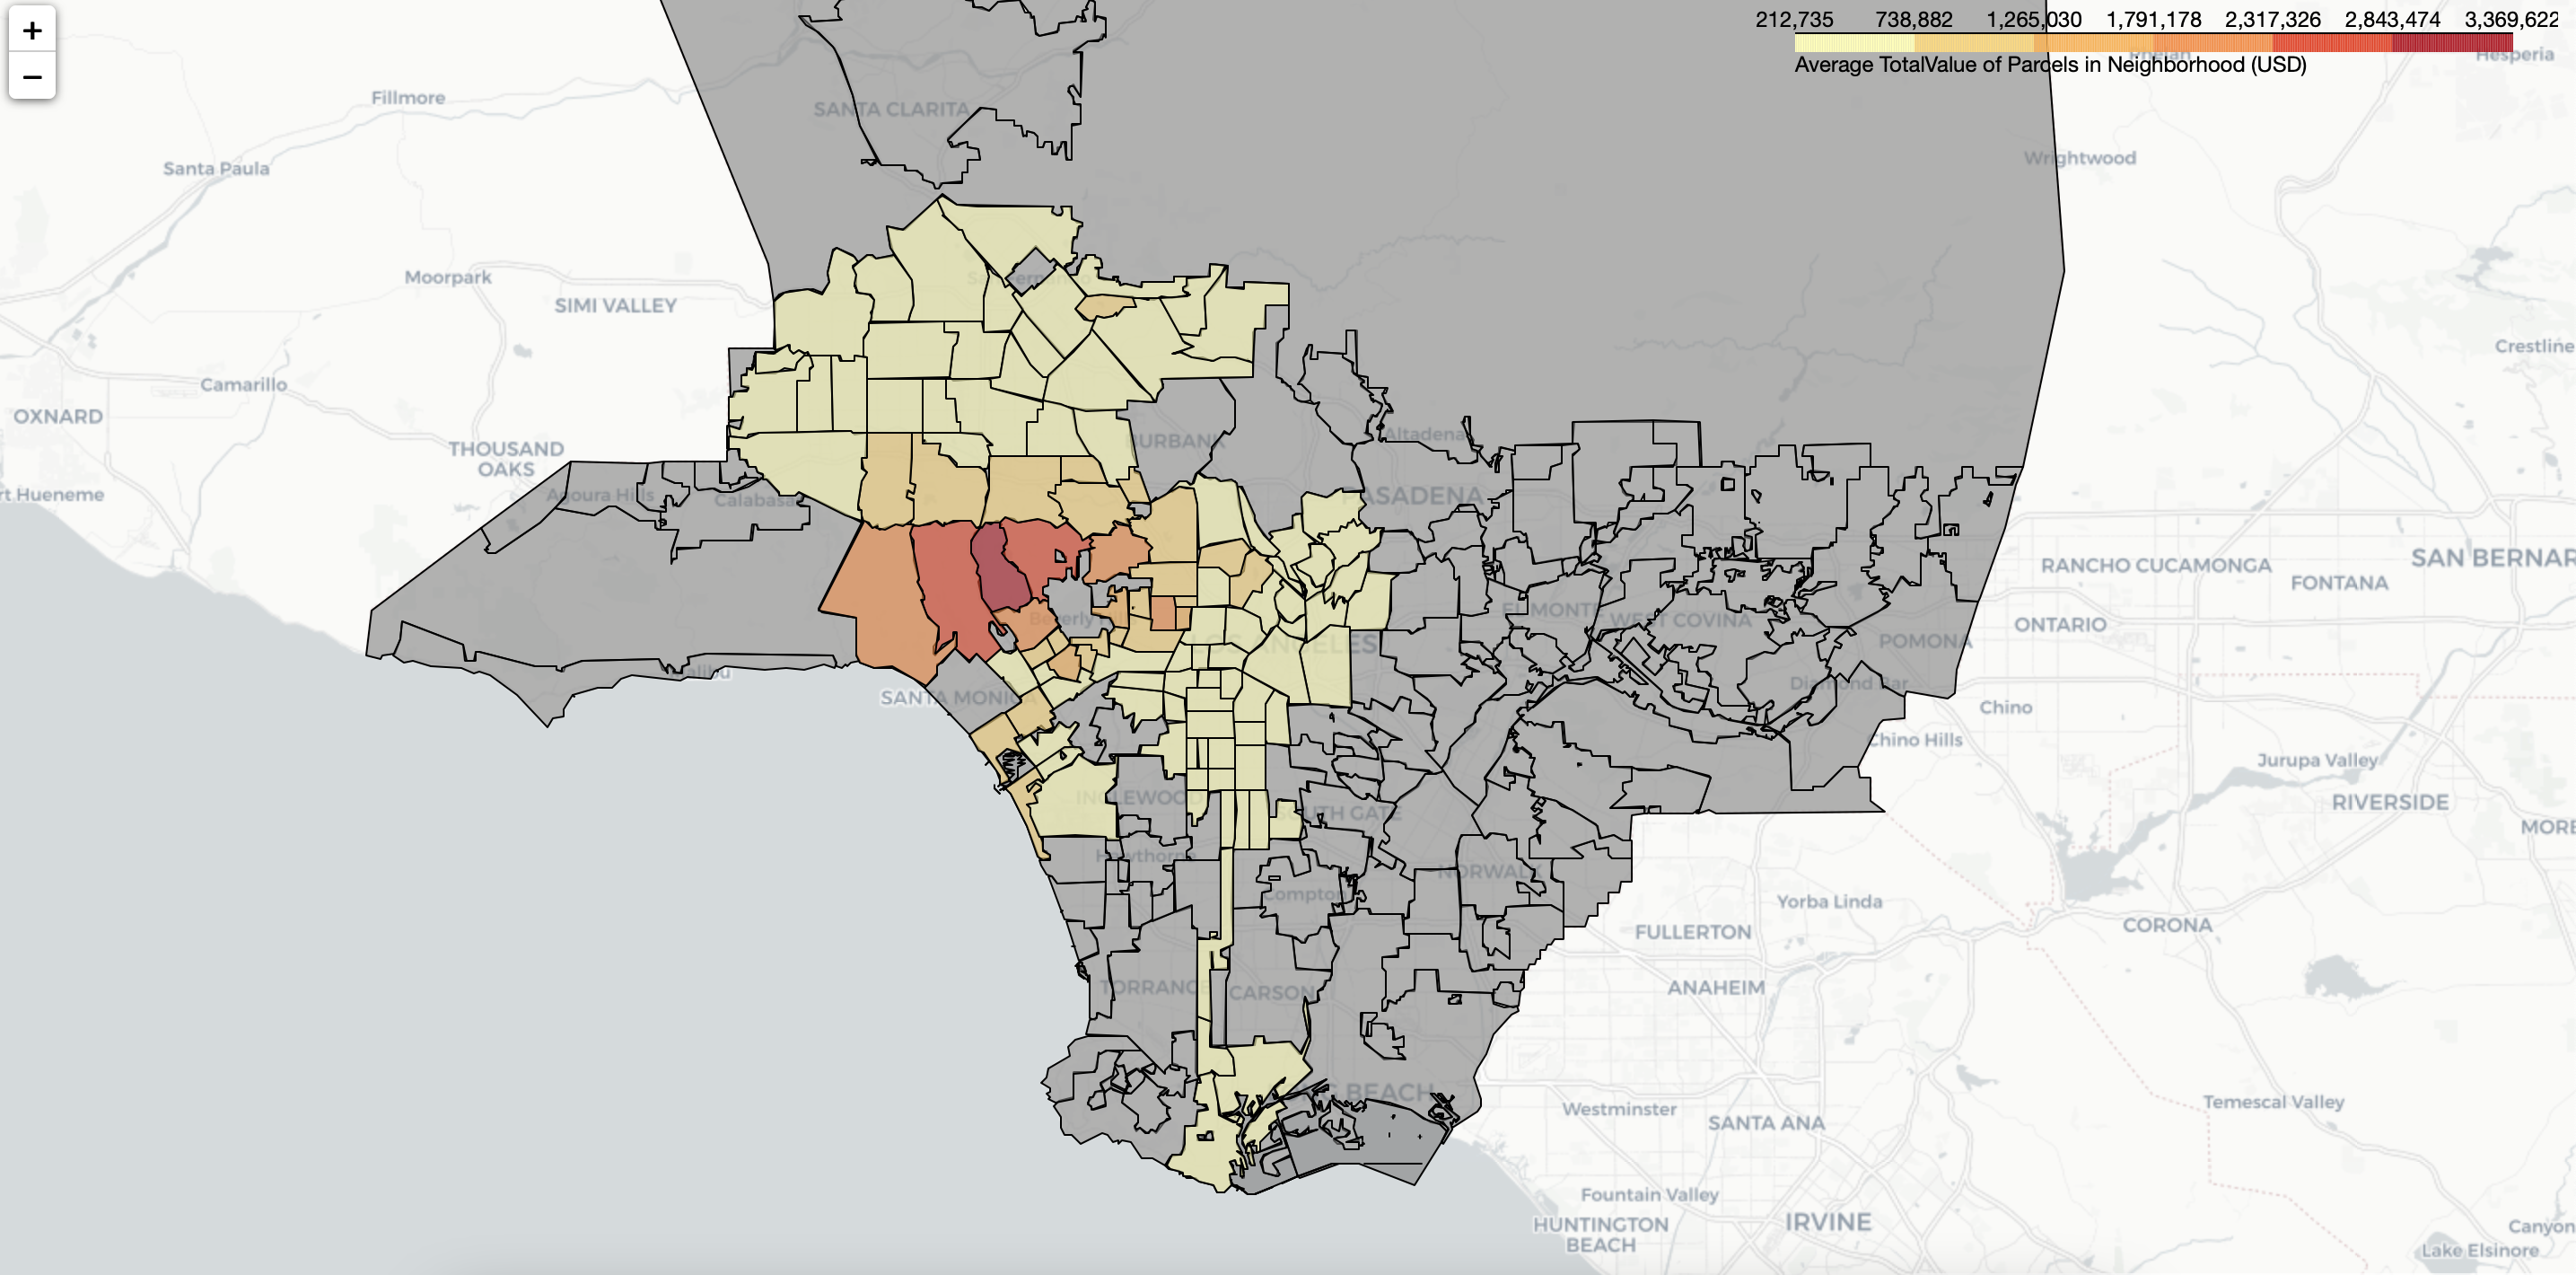
Because the original dataset had a massive file size, parcels outside the City of Los Angeles were excluded from data exploration. Each parcel was located based on its coordinates, and the neighborhood of each parcel was determined based on the geographic dataset of LA City neighborhoods. In total, 114 neighborhoods were found within the LA City boundaries, and these neighborhoods can be seen in Figure 1, which also highlights the average total values for each neighborhood in 2021.
Figure 1 - Average Total Value of Single-Family Residence Parcels in LA City
In addition, new features were extracted from the geographic dataset for LA County parcels, which are ShapeSTarea, ShapeSTLen, and geometry. These features were verified using GeoPandas functions to locate the latitudes and longitudes of the parcels, which were the original variables CENTER_LAT and CENTER_LON in the dataset. Regression analyses were then conducted between the total value of the parcel and each chosen feature. As depicted in Figure 2, a few visualizations were created to investigate if there is a valid pattern between the total value and the selected features. Some features were excluded because of an unexplanatory correlation to the total parcel values.
Data explorations were also conducted beyond the original features. Since the scope of the project is to investigate parcel values, aspects related to living quality were considered and reviewed. One aspect was transit accessibility, and two features, BusBenchClosestDist and SubwayStopClosestDist were created to understand if transit accessibility can reflect the parcel value. Another aspect was the safety of the neighborhoods. For this reason, the most recent crime data were retrieved from the LA City website. In the beginning, in cases of any induced bias, crimes that happened beyond the dwelling property line were not considered. As a result, only trespassing data was selected for the exploration. However, further analysis suggested no significant relationship between the annual trespassing incidence and the average parcel value in the neighborhoods. Instead, a moderate pattern was discovered between crime incidence and the total value of parcel when including all crime types. Consequently, a new feature, crime_count, was created and added to the main dataset. To enlarge the number of features in the dataset, the tidiness of neighborhood streets was considered, and geographic dataset was downloaded from LA City geohub website. As a result, five features were created to reflect the correlation between the neighborhood street tidiness and parcel values: (i) cleanliness score (C_score), (ii) bulky items score (BI_score), (iii) illegal dumping score (ID_score), (iv) weed score (WD_score), and (v) litter score (LL_score).
Data Cleaning and Preparation#
As a first step, data cleaning was carried out. Data for residential parcels, especially single-family residence parcels, was first filtered from the raw dataset. The cleaning process filtered every parcel with “Residential” for its GeneralUseType, “SFR” for its PropertyType, and “1” for its Unit number in the parcel. The number of unique parcels was reduced from 2,485,732 to 639,663 which indicated that about 26% percent of the parcels in LA County were Residential — SFR — 1 Unit parcels in LA City. During the cleaning process, a small amount of the dataset was also removed such as unusual parcels (e.g., modular homes and planned developments) from PropertyUseCode column. As an example, single-family residences were classified based on certain criteria: (i) “0100” represents “Single Family Residence with no pool”, (ii) “0101” represents “Single Residence with Pool”, (iii) “0103” represents “Single Residence with Pool and misc.”, and (iv) “0104” represents “Single Residence with Therapy Pool”. For the scope of our project, only the parcel data with PropertyUseCode of “0100”, “0101”, “0103” or “0104” were considered, and other types of properties (accounts for less than 4%) were removed from the dataset. One of the existing columns, totBuildingDataLines, shows how many individual structures are in the parcel. Since Unit number was limited to “1” in the previous steps, parcels with totalBuildingDataLines greater than one were also removed. Moreover, there were public parcels such as non-taxable and government-owned parcels in the raw dataset. To ensure the dataset contains only private parcels, these public or special-use parcels were removed by filtering the SpecialParcelClassification column. Among the original features, there were features/columns with the same value for every parcel, and these features/columns were considered redundant. For example, every selected parcel had a value of “YES” for column isTaxableParcel.
Figure 2 - Correlation Between Some Selected Features and Total Value
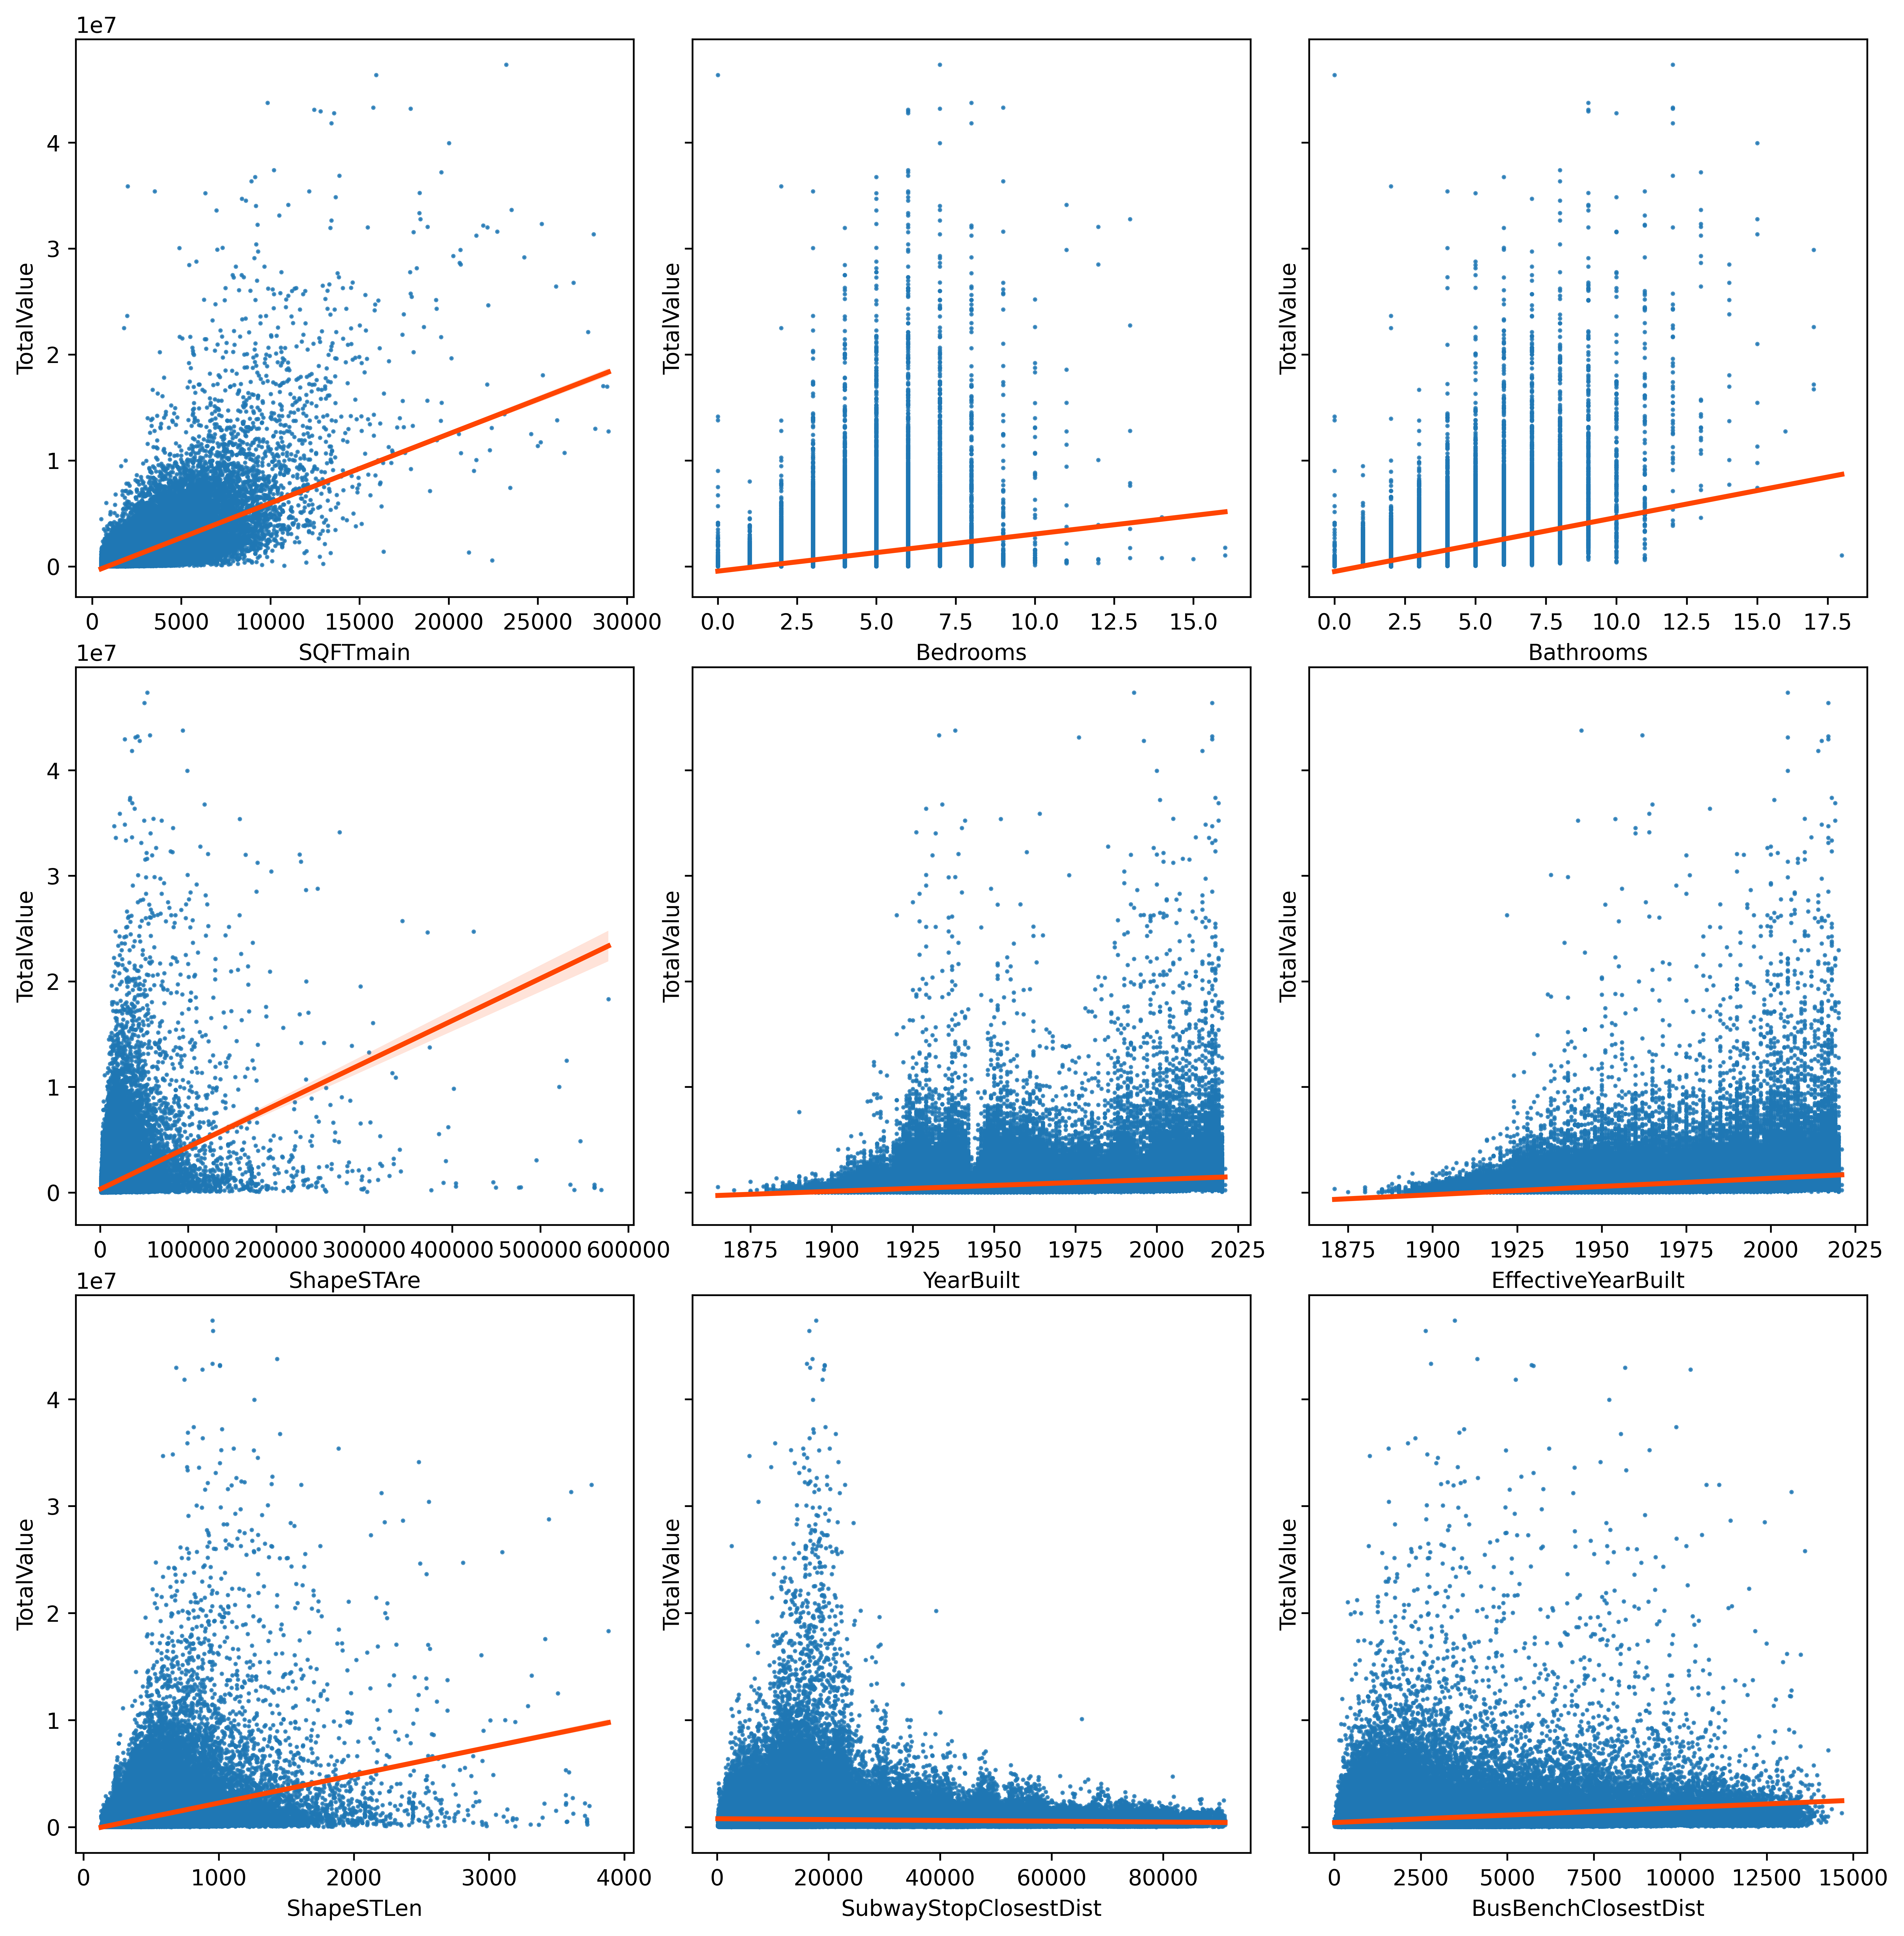
As discussed in the previous section, visualizations of every feature were created, and some of them are shown in Figure 2. Besides the investigation of correlation patterns, there were also some outliers or obvious misleading data that needed to be removed. Based on the observation, parcels with unreasonable building ages were removed by filtering BuiltYear and EffectiveYearBuilt after the year 1850. EffectiveYearBuilt describes the year of the most recent renovation for the parcel. Similarly, parcels with LandBaseYear of 1907 were observed to have unreasonable patterns and therefore removed.
Cleaning was also done on quantitative data to eliminate misleading outliers. Parcels with TotalValue more than 50M USD were removed. Parcels with more than 19 bedrooms and more than 20 bathrooms were removed. For the geometry of the parcels, the SQFTmain of the parcels were limited to a range of 500 to 40,000 square feet to be statistically clean for the model. Also, the ShapeSTAre, which describes the area of the parcel property, were limited to a range of 1,000 to 600,000 square feet, and ShapeSTLen, which describes the length of the parcel property, were limited up to 4,000 feet. To summarize, it was identified that only 0.2% of the selected dataset is comprised of outliers, and these were filtered out before developing a ML model.
Trends in Los Angeles City#
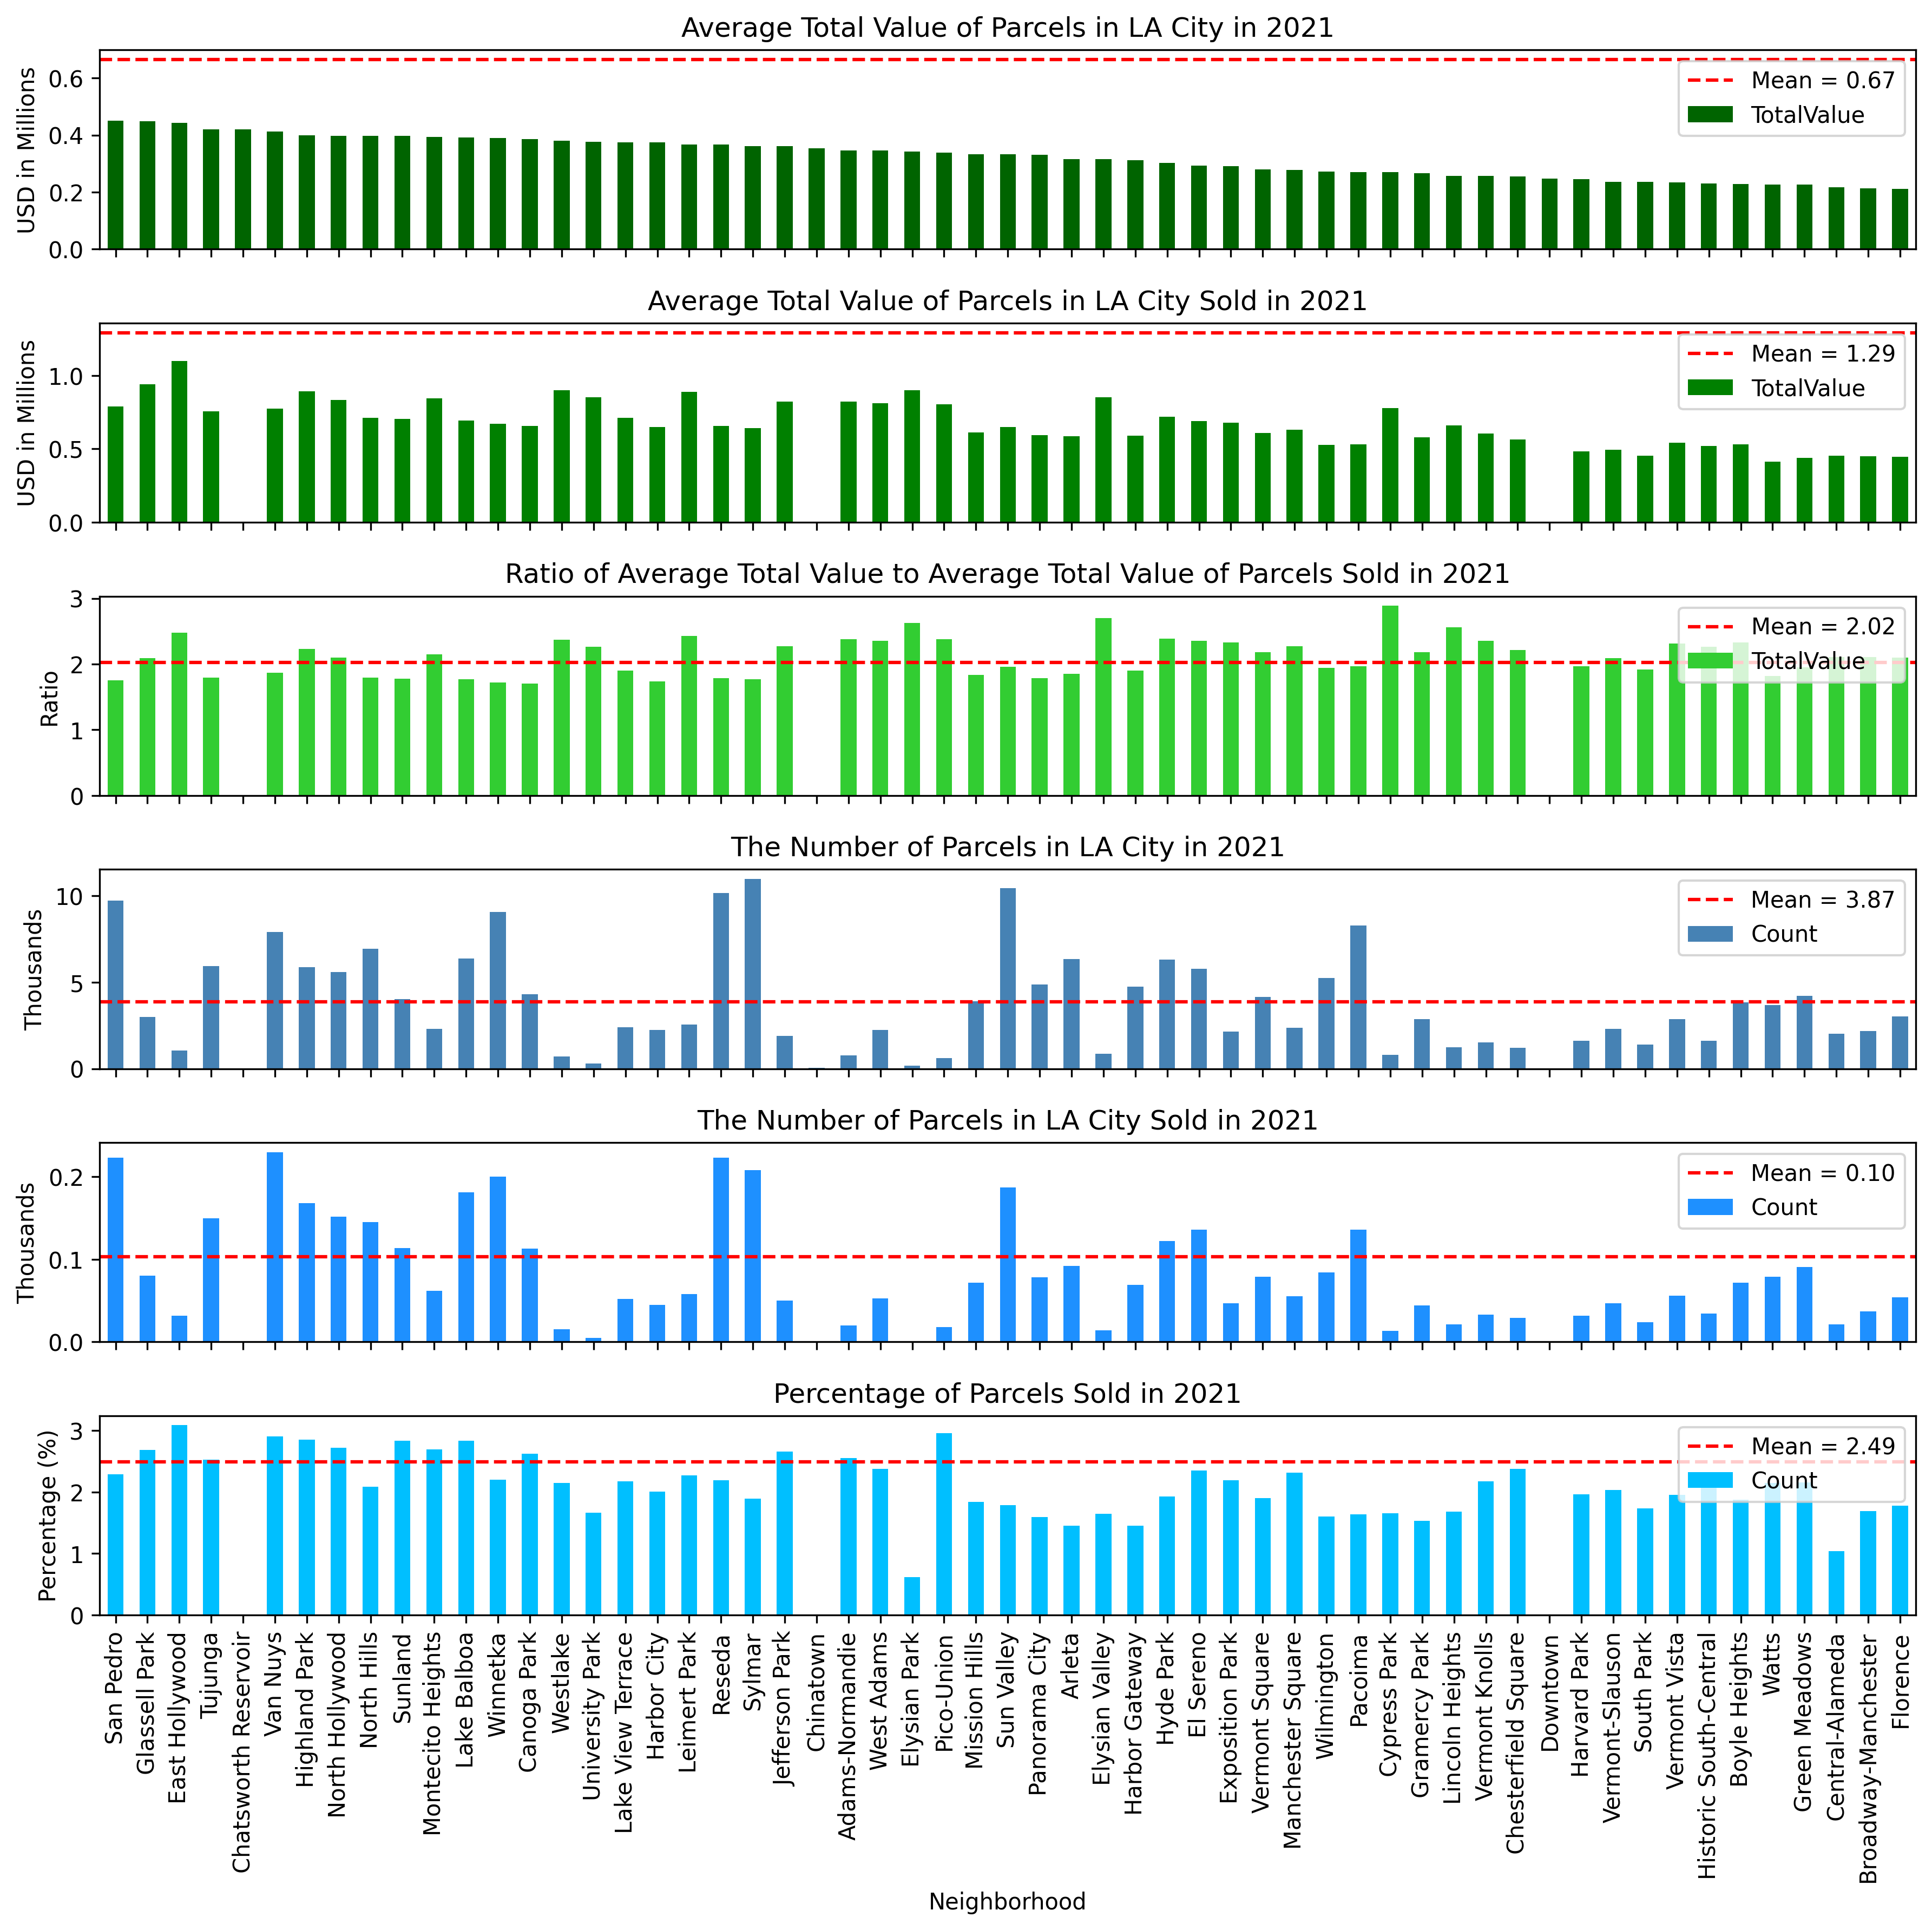
LA City has 114 neighborhoods, and it is expected that some of them are more expensive than others. To see if there is such a trend in LA City, the average total value for each neighborhood was estimated from the filtered dataset. Figures 3 and 4 show the most recent (2021) average total value of each neighborhood, along with the average total value of parcels sold in 2021. These data were divided into two plots to make them more readable (Figure 3 for the first half and Figure 4 for the second half). The figures also include the number of parcels in each neighborhood and the number of parcels sold in 2021. As can be seen from Figures 3 and 4, Bel-Air, Beverly Crest, and Brentwood are the most expensive neighborhoods in LA City. The average total value of a single parcel is more than 2.75M USD in these three neighborhoods, whereas the average total value in LA City is about 670K USD which shows an unequal distribution among the neighborhoods. In total 36 neighborhoods are priced above the mean, and 78 of them are below the mean. On the other hand, the average total value of the parcels sold in 2021 (See the second row in Figures 3 and 4) indicates that parcels were actually sold twice as much as the average total value of parcels in each neighborhood in LA City. This ratio can be seen in the third row of Figures 3 and 4 for each neighborhood.
Figure 3 - Average Figures for Each Neighborhood in LA City in 2021 (First half)
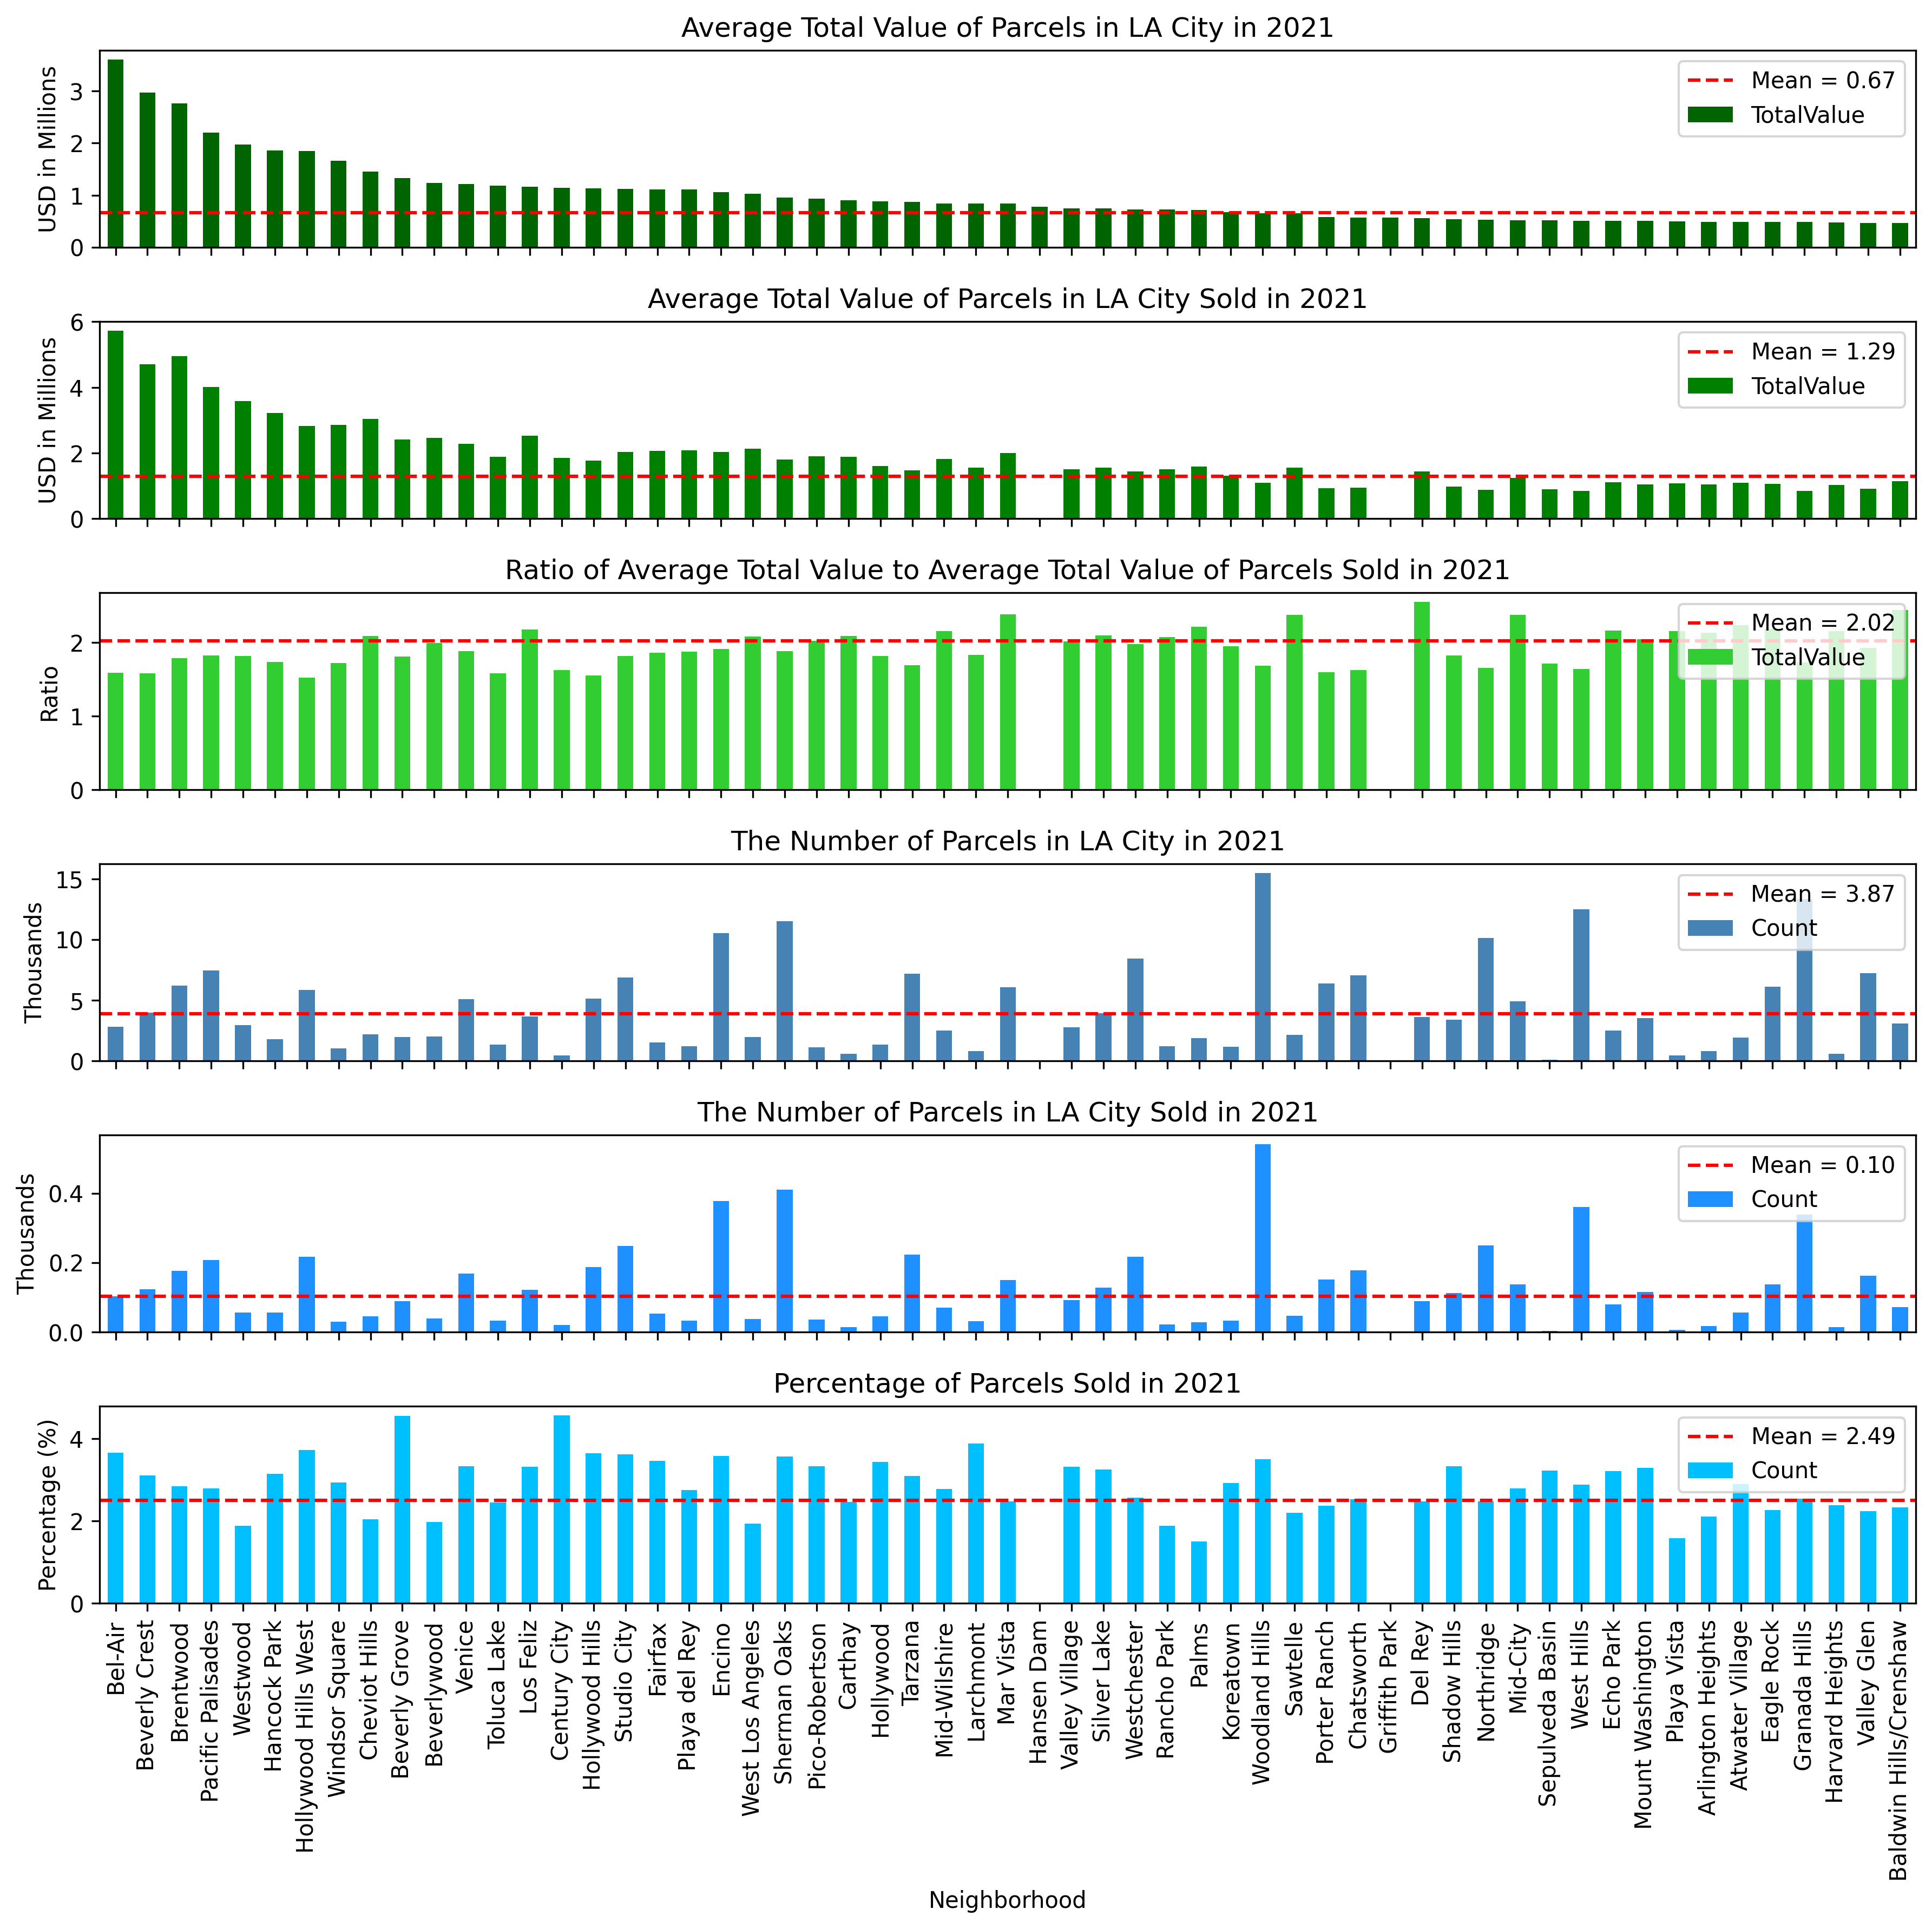
In terms of the number of parcels in LA City, Woodland Hills contains more than 15,000 parcels in the neighborhood, and Granada Hills and West Hills have about 13,000 parcels within their boundaries. As expected, the most-selling neighborhood in 2021 was Woodland Hills with more than 540 parcels sold. There were no sales in five neighborhoods in 2021 (Hansen Dam, Griffith Park, Chatsworth Reservoir, Chinatown, Downtown), but these also do not have many parcels available to be sold (94 parcels in total). The last row in Figures 2.3 and 2.4 shows that, on average, 2.5% of the total parcels in each neighborhood were sold in LA City in 2021. The top and lower boundaries of this trend are 4.55% (Century City) and 0.6% (Elysian Park).
Figure 4 - Average Figures for Each Neighborhood in LA City in 2021 (Second half)
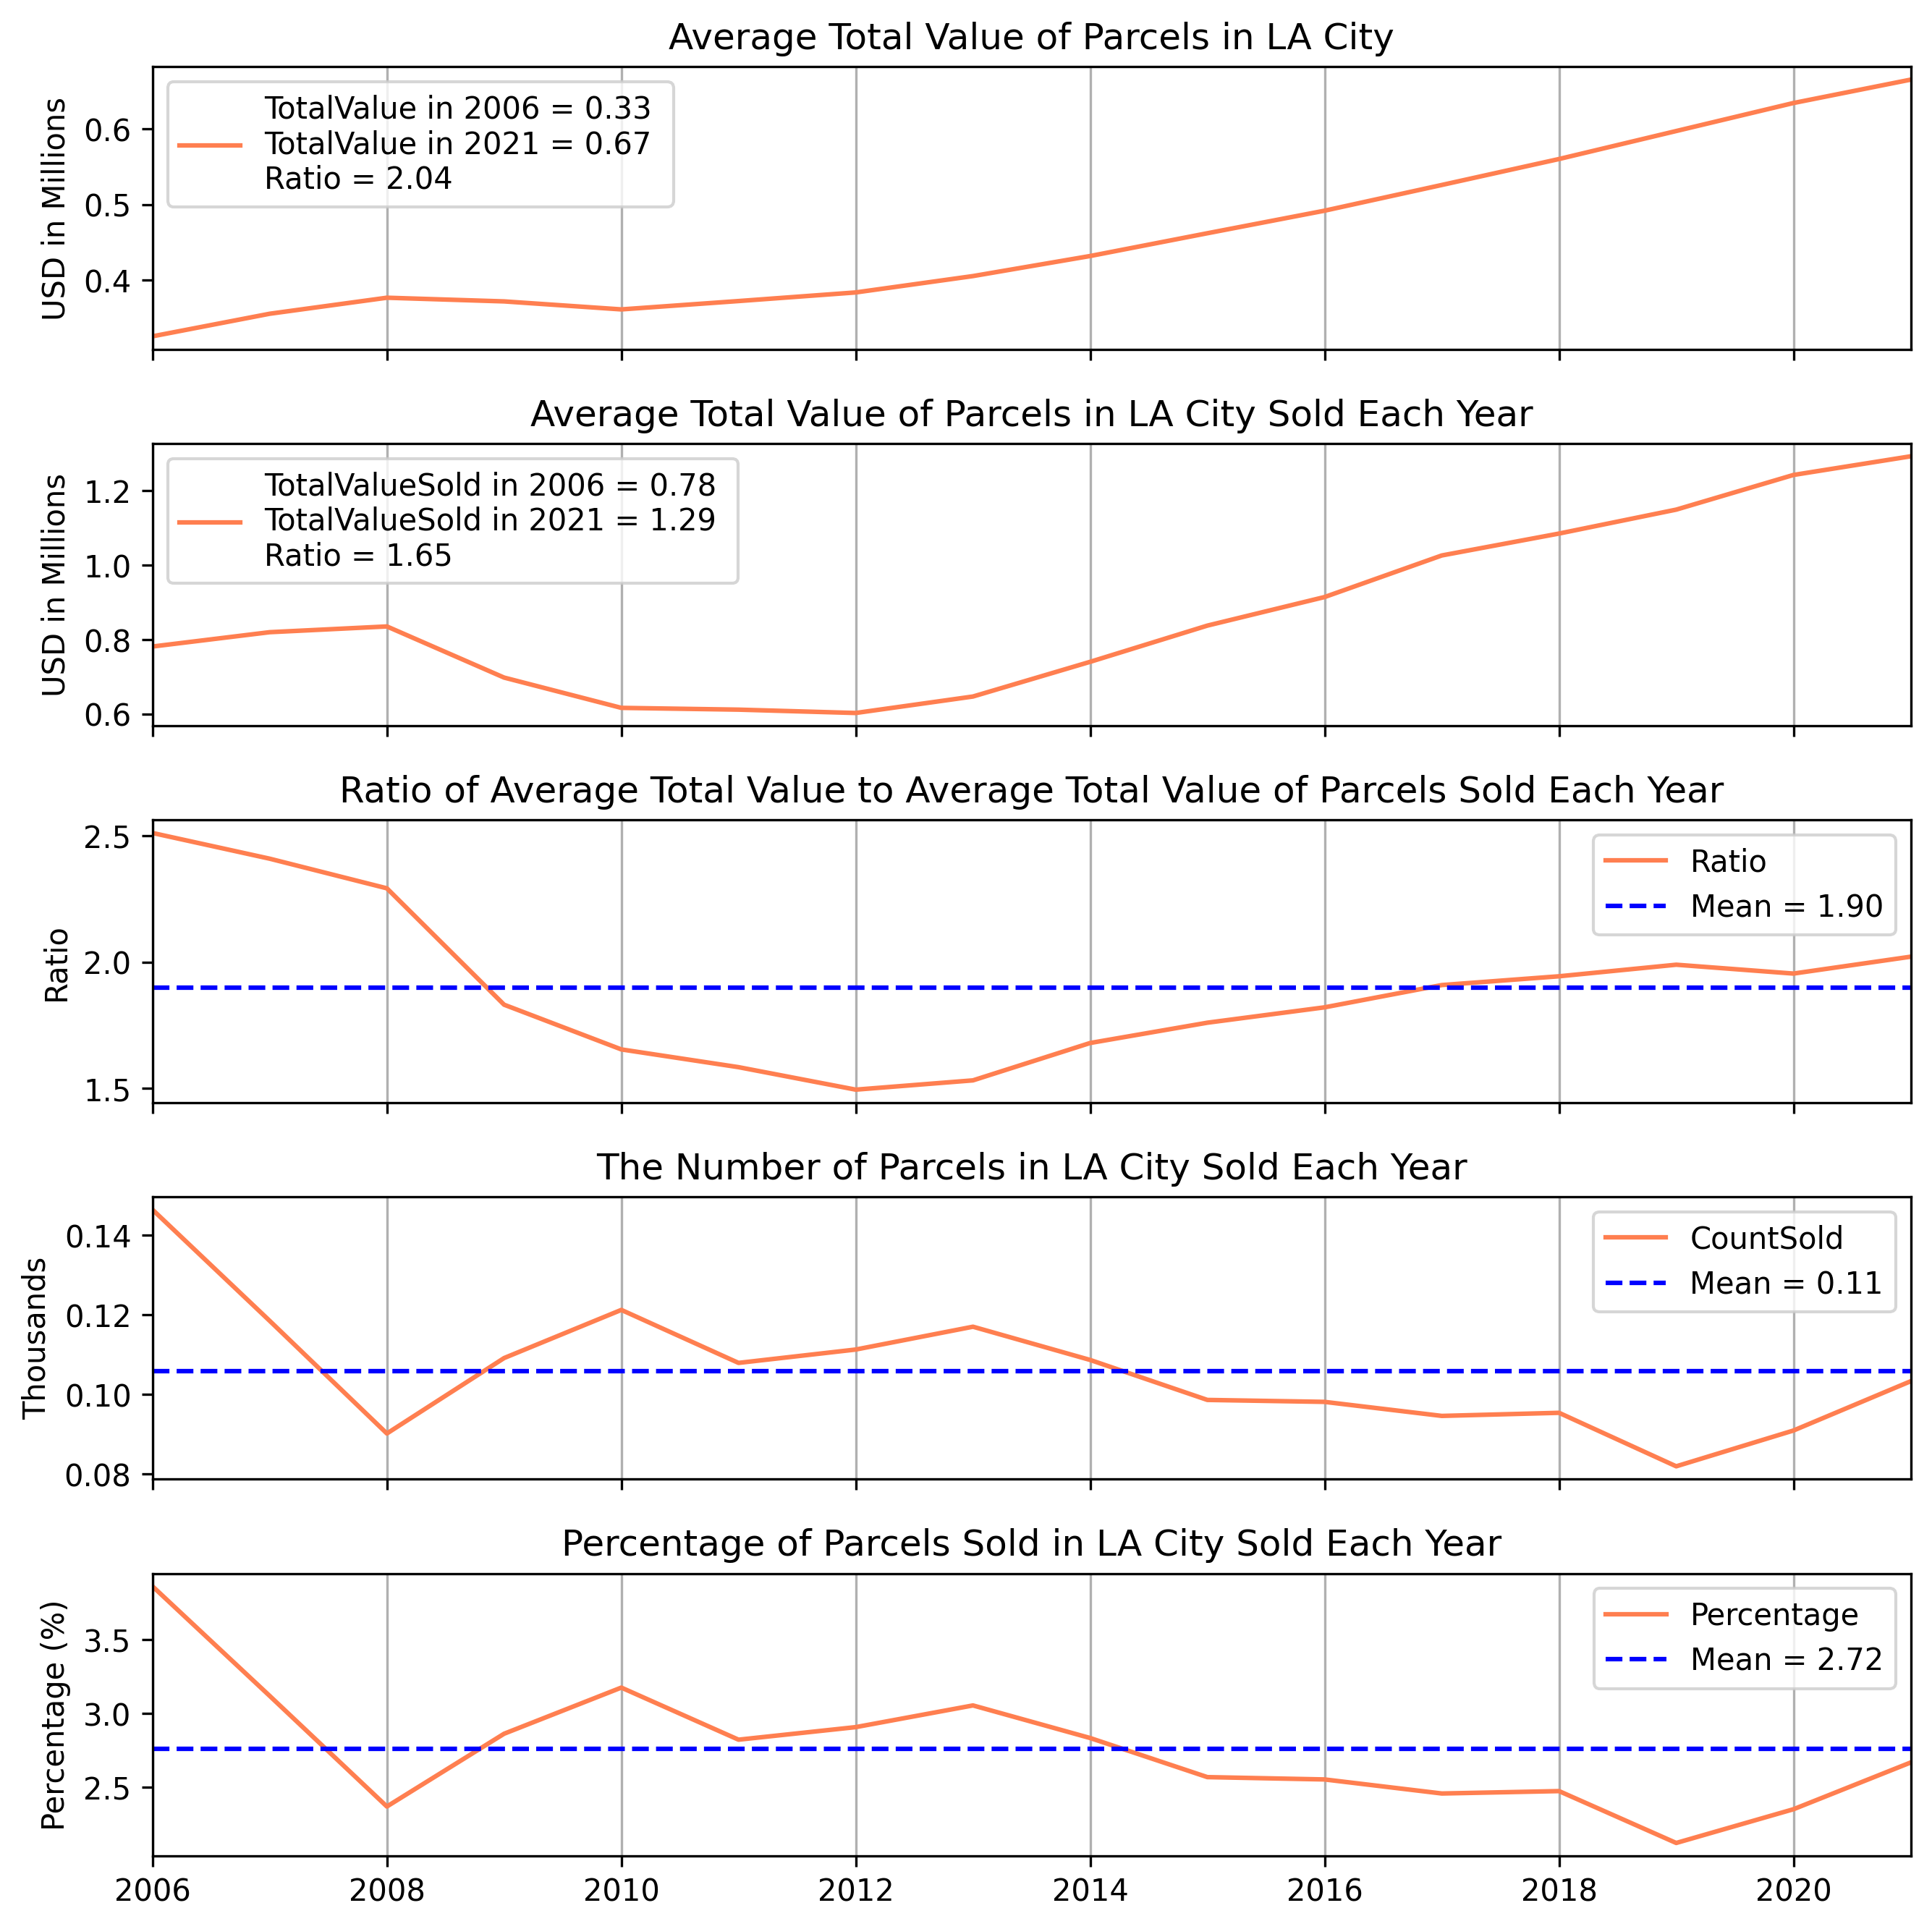
The annual changes in the total value of parcels could be another interesting trend to discover. For this purpose, the average total value for each year was calculated and plotted in Figure 5, together with the average total value of parcels sold each year and the number of parcels sold each year. The first row in the figure shows that the average total value of parcels has increased more than 100% in LA City over the 16-year period. Once it comes to the parcels sold each year, the increase in the total price over the 16 years is lower, 65%. The third row in Figure 5 shows how much the selling price has changed over the years. On average, a parcel was sold for 90% more than the average total value in LA City. However, this trend was around 150% in 2006 and started declining with the Housing Bubble in 2008–2009. It could not recover back to the same value in 2006 within 16 years but started climbing after 2012, and currently, it is above the 16-year average. The fourth row of Figure 5 shows the number of parcels sold each year. It can be seen that the Housing Bubble caused a significant decline in sales in 2008. However, it seems likely that people took advantage of cheaper housing prices (see the second row) in the following years until 2014. After that time, there was a consistent decrease in sales in LA City and a dip in 2019. Figure 5 illustrates that single residential home sales have started increasing again in the last two years, and the reason could be promoting remote working during the pandemic (COVID-19). Lastly, on average, 2.7% of parcels were sold annually in LA City.
Figure 5 - Annual Change in Average Total Value of Parcels in LA City
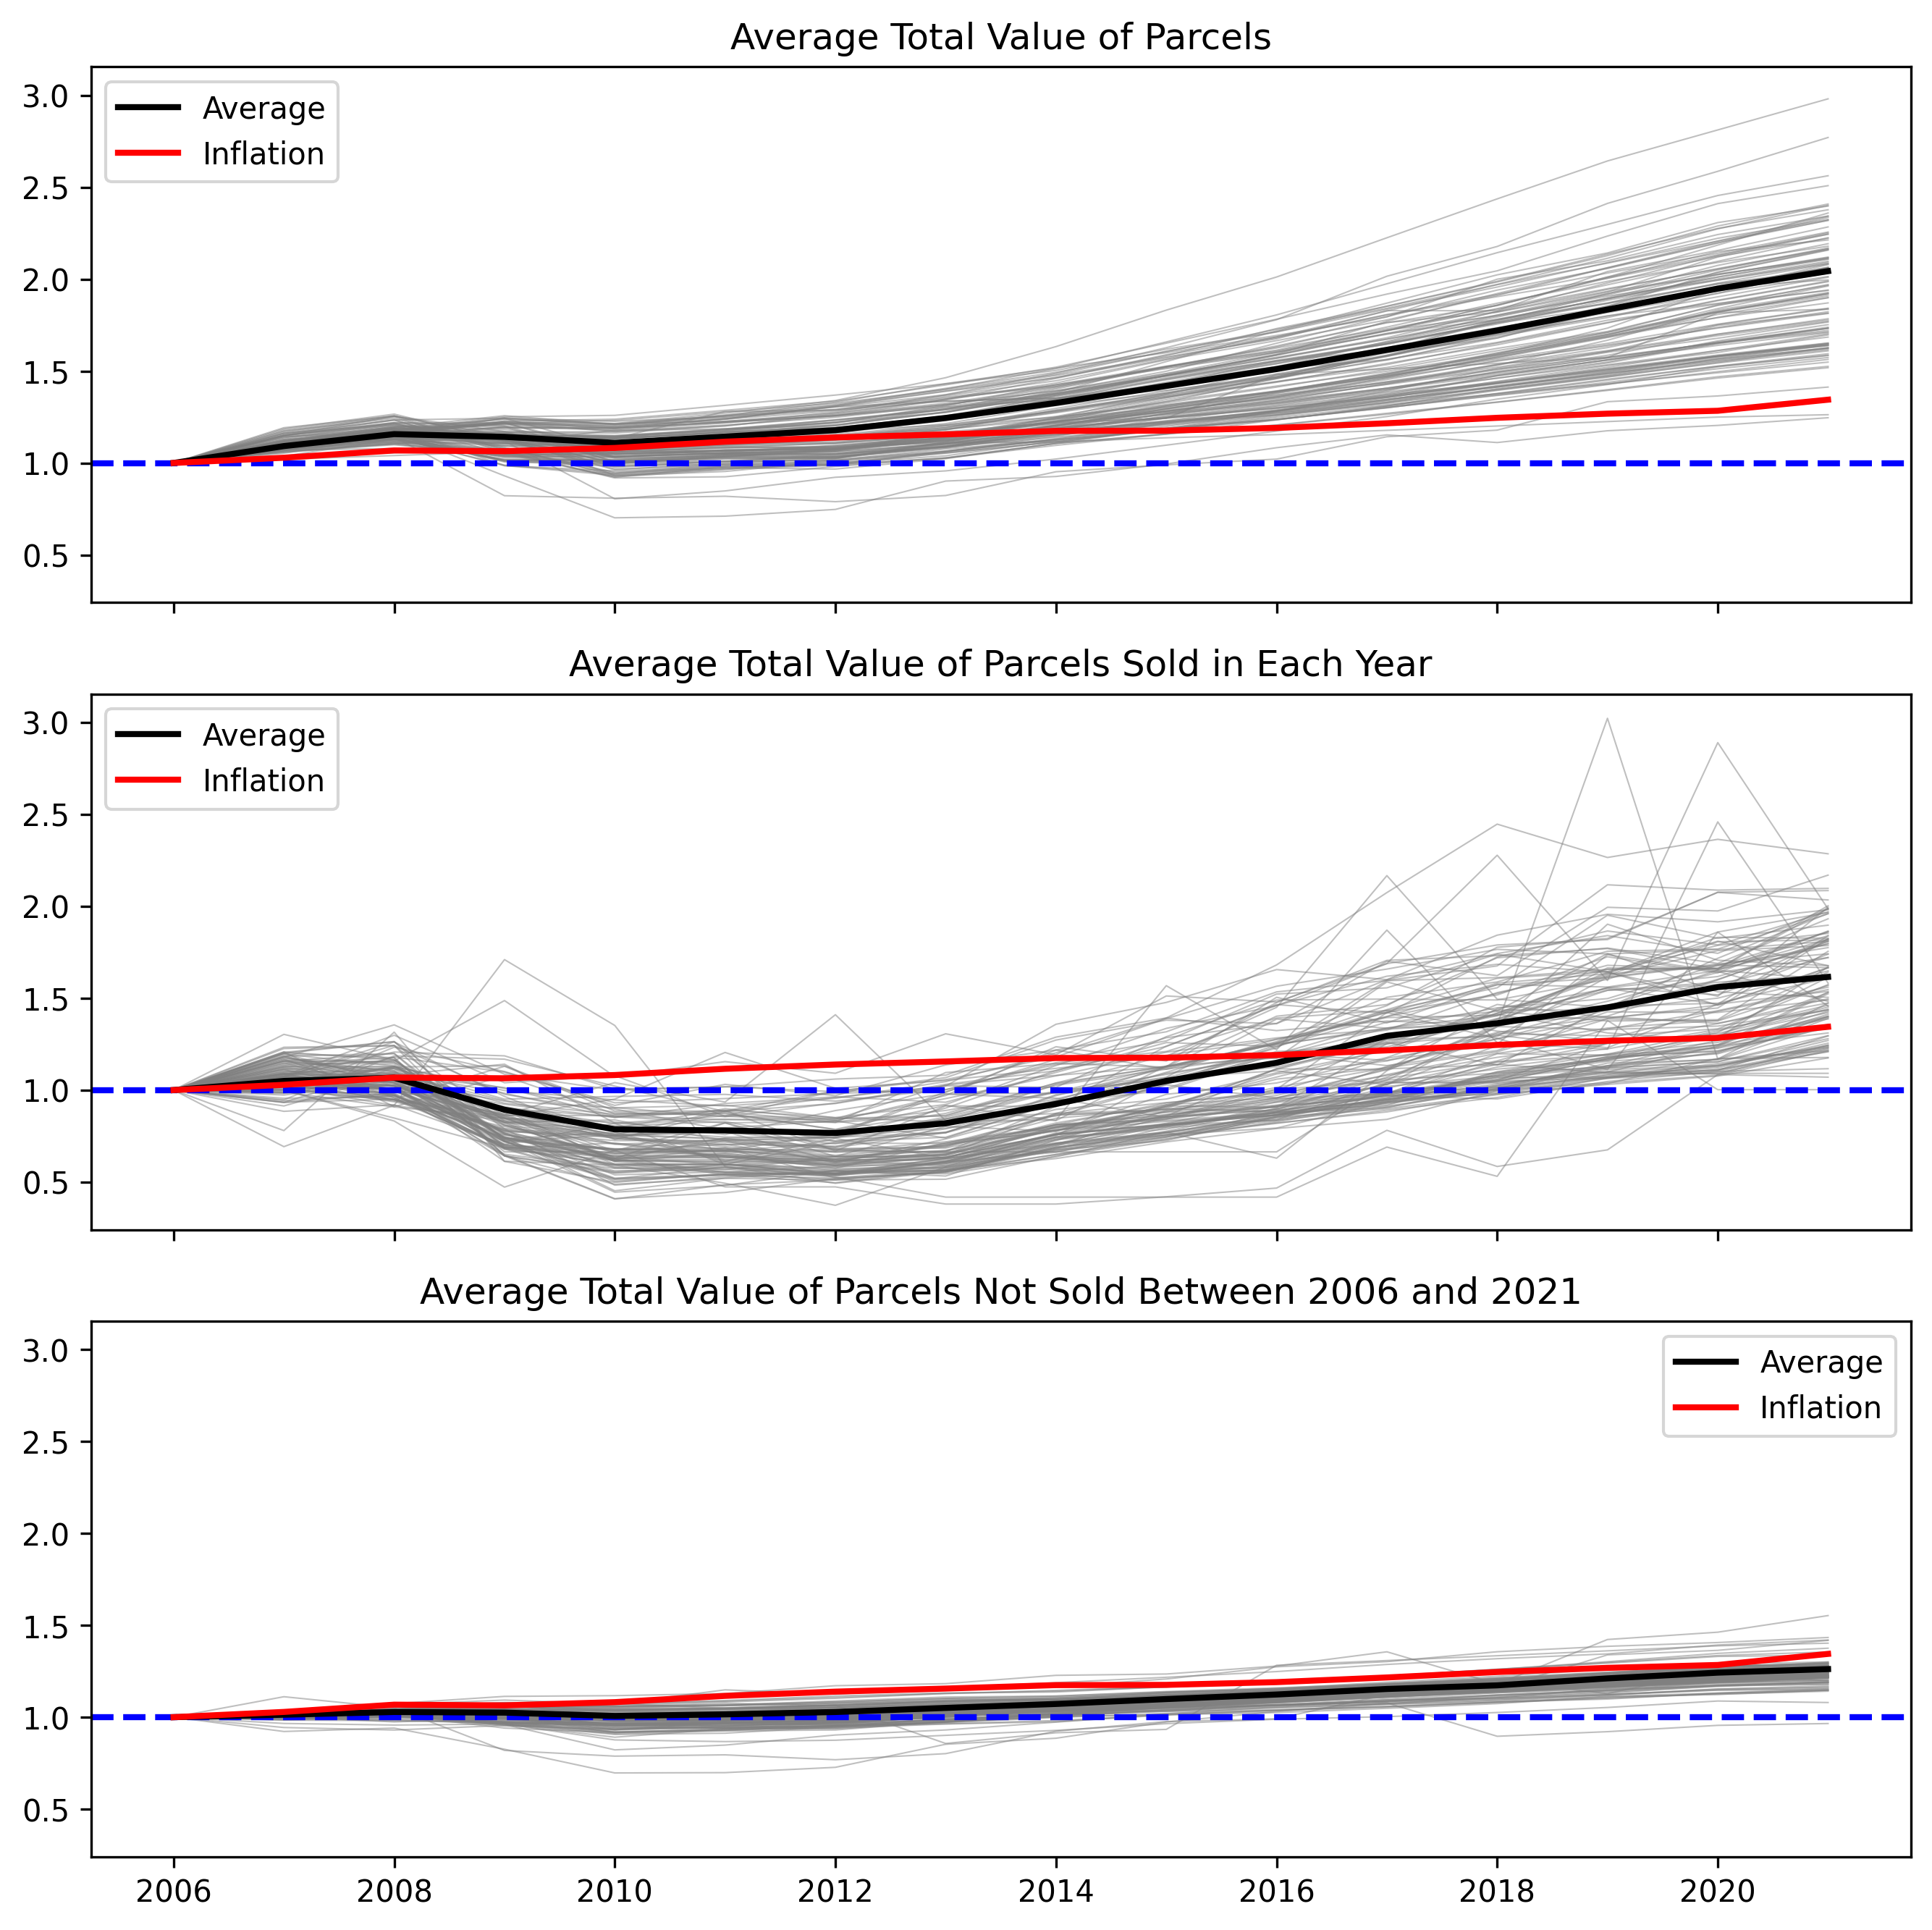
Last but not least, it is important to uncover how the Housing Bubble has affected selected parcels in LA City. As can be seen from Figure 6, the average total value of parcels for each neighborhood was normalized based on the average value in 2006. In this way, we could observe the average value change for each neighborhood over the 16-year period. From the first row of Figure 6, the average value of parcels was never below the inflation rate. However, two neighborhoods, Downtown and Griffith Park, remained under the inflation rate in 2021. This can be attributed to the number of available single-family residential parcels in these neighborhoods, as mentioned earlier. On the contrary, Beverly Grove tripled its value in 2006. Fairfax, Venice, and Beverlywood followed with a more than 150% increase over the 16-year period. On average, almost a 100% increase was observed in the average total value of parcels. More importantly, the average value of neighborhoods shows a diverging trend, and this might result in inequality among the neighborhoods of LA City. If parcels sold each year were considered, the story would be different. With the Housing Bubble, the average value of parcels sold each year in LA City remained below the inflation line for more than eight years. This sharp decline in average parcel prices was mainly caused by the Housing Bubble and its effects, which lasted more than 12 years for some neighborhoods. Moreover, most of them could not even exceed the inflation line in 2021. Lastly, the third row of Figure 6 illustrates the average value of parcels not sold within the last 16 years. Although it has a similar trend to the inflation line, the increase in average value was slightly lower than the inflation rate, which might be an advantage for landowners in terms of tax payments.
Figure 6 - Normalized Annual Change in Average Total Value of Parcels in LA City